Generalized People Diversity: Learning a Human Perception-Aligned Diversity Representation for People Images
Abstract.
Capturing the diversity of people in images is challenging: recent literature tends to focus on diversifying one or two attributes, requiring expensive attribute labels or building classifiers. We introduce a diverse people image ranking method which more flexibly aligns with human notions of people diversity in a less prescriptive, label-free manner. The Perception-Aligned Text-derived Human representation Space (PATHS) aims to capture all or many relevant features of people-related diversity, and, when used as the representation space in the standard Maximal Marginal Relevance (MMR) ranking algorithm (Carbonell and Goldstein, 1998), is better able to surface a range of types of people-related diversity (e.g. disability, cultural attire). PATHS is created in two stages. First, a text-guided approach is used to extract a person-diversity representation from a pre-trained image-text model. Then this representation is fine-tuned on perception judgments from human annotators so that it captures the aspects of people-related similarity that humans find most salient. Empirical results show that the PATHS method achieves diversity better than baseline methods, according to side-by-side ratings from human annotators.
1. Introduction
Image ranking systems often mediate how we access and discover images — through web-based recommendation (Wang et al., 2012; **g and Baluja, 2008; Yu et al., 2014), dataset curation (Deng et al., 2009; Yang et al., 2020), and even image generation systems (Yu et al., 2022b). When we query these systems for images of people, what the system surfaces can shape our perceptions by reinforcing or dismantling stereotypes (Kay et al., 2015). As such, there is growing interest to make the top-ranked results for people-seeking queries more diverse. (Silva et al., 2023; Karako and Manggala, 2018; Celis and Keswani, 2020; Noble, 2018; Otterbacher et al., 2018).

The term “diversity” carries two distinct meanings in the context of image ranking. Firstly, in traditional recommendation systems, which employ image ranking, “diversity” means providing users with a range of visually novel, but still relevant, results to their query (Van Leuken et al., 2009; Carbonell and Goldstein, 1998; Celis et al., 2016; Qian et al., 2017). Secondly, from a sociological perspective, “diversity” refers to people (Plaut et al., 2015; Ashkanasy et al., 2002). While exact definitions vary, “diversity” in this paper is used to refer to the variety of sociocultural identities (e.g., cultural backgrounds, lifestyles, nationalities, religions) represented within a group of people. The goal of the image recommendation systems in this paper is to achieve diversity in the second sense while maintaining quality: to surface query-relevant images that also showcase a range of perceived sociocultural identities. Though this paper is grounded in an image recommendation use case, this work may also be of interest in other areas that require evaluating diversity in a set of images such as dataset curation.
Improving person-diversity in an image ranking or recommendation system presents a key design decision: how should one encode sociocultural identity information about people in a way that the ranking algorithm can understand and effectively use? In Fig 2 demonstrates a spectrum of options, highlighting two contrasting failure modes. One naive approach is to treat all visual information equally and apply standard diversification techniques (e.g., submodular maximization, MMR (Borodin et al., 2012; Carbonell and Goldstein, 1998)). This, however, leads to overly broad diversification where the algorithm might focus on elements like image backgrounds or styles, instead of prioritizing the diversity of the people in the images (Celis et al., 2016).
Recent work has addresses this by narrowly focusing on a few structured ”sensitive attributes” for diversification (Karako and Manggala, 2018; Silva et al., 2023; Mehrab Tanjim et al., 2022). Often, this means diversifying based on perceived gender expression and/or skin tone. While this is better than the naive approach, it has a key limitation: defining diversity through a few specific attributes restricts how richly we can represent the diversity of people. Consequently, existing work in this area often reduces diversity narrowly to only gender expression and/or skin tone (Celis and Keswani, 2020; Mehrab Tanjim et al., 2022). This simplification is at odds with the complex way we socially perceive diversity, which is influenced by a far wider range of sociocultural factors (Jackson et al., 2003) like ethnicity (Rattan and Ambady, 2013), perceived gender expression (Lindqvist et al., 2021), cultural attire (Reeves et al., 2012; Ghumman et al., 2013), body shape (de Freitas et al., 2018), age (Kunze et al., 2011) and more.
This ”narrow” approach to diversification, which focuses on a limited set of pre-defined ”sensitive attributes,” has three algorithmic limitations. Firstly, it is inherently a prescriptive process that depends on the algorithm designers’ own understanding of what diversity “matters”. This can introduce biases that exclude non-normative images (e.g. women without long hair, people in wheelchairs) (Denton et al., 2021; Prabhu and Birhane, 2020). Secondly, the reliance on a fixed list of attributes (usually with discrete labels and equal weighting among attributes) makes the system inflexible and unable to fully capture the complexity of human diversity. Finally, the requirement to label every image for each attribute (Schumann et al., 2023) is a costly, ethically challenging, and difficult task to scale with legal and privacy risks (Andrews et al., 2023; Prabhu and Birhane, 2020; Wu et al., 2020). The availability of existing attribute data during the design stage further biases the system towards specific well-studied attributes. Collectively these limitations can result in biased outcomes, inflexibility, and ethical challenges that limit creating a truly inclusive representation of diversity.

Given the limitations of overly ”narrow” (fixed attribute list) and excessively ”broad” (all visual diversity) diversification, the goal is to find a balanced way to represent sociocultural identity. This paper introduces Perception-Aligned Text-derived Human representation Space (PATHS ), a continuous representation space for people images. Unlike narrow fixed-attribute-list methods, it avoids the need for predefined attributes, or prescriptive discrete labels or similarity metrics, reducing the potential for bias from the system designer, and the need for costly labeling. Importantly, similarity in PATHS aligns with human perception of similarity between people in images. This means demographically similar people in different settings (ex: Gottfried Leibniz writing at a desk and Isaac Newton sitting under an apple tree) should be close together, while demographically dissimilar individuals in similar settings (ex: Gottfried Leibniz writing at a desk and Katherine Johnson writing at a desk) would be further apart in the representation space.
PATHS is learned as a refinement of a general image-text embedding (Yu et al., 2022a), with two fine-tuning steps that prioritize flexibility in the types of diversity we can learn without attribute labels: text-guided subspace extraction, where we learn a low-dimensional projection intended to remove non-person information, and perception alignment, where this projected subspace is further modified to align more closely with human-annotated diversity judgments. Experiments demonstrate how PATHS achieves the right balance of diversification (See Fig. 2) through showing strong performance on two contrasting datasets: the canonical Occupations dataset(Celis and Keswani, 2020) which penalizes overly-broad diversification methods, and a new dataset: the Diverse People Dataset, which penalizes overly-narrow methods respectively. PATHS achieves the best average performance ( diversity increase) across both datasets, demonstrating its effectiveness as a representation space for comprehensive people-diversity. Moreover, qualitative case studies demonstrate instances where PATHS better captures the specific diversity types human annotators find important.
1.1. Contributions
This paper includes the following contributions:
-
•
A method to learn a representation space that can be used for diverse ranking of people images. Notably, this method does not require or encourage predefining a notion of diversity through a short list of strictly-taxonomized attributes (e.g. perceived gender expression, skin tone), or training on photos labeled for such attributes. This method consists of a standard diversification algorithm applied to our new Perception-Aligned Text-derived Human representation Space (PATHS).
-
•
Empirical results showing that PATHS achieves the strongest ranking diversity across both the Occupations dataset(Celis and Keswani, 2020), and the new Diverse People Dataset created for this paper, showing both the ability to diversify along a range of people attributes, as well as to discount non-people attributes in diversification, achieving a good tradeoff between narrow and broad diversification methods.
-
•
Evidence that perceptions of diversity are complex: human annotators give more weight to some people-related attributes over others in diversity perception judgements. Case studies show where the PATHS method—unlike other methods—agrees with human perception by correctly weighting these people-related attributes more.
2. Related Work
Diversity in Ranking and Recommendations.
Significant work exists on producing diverse rankings or subsets in web systems. These works seek to balance diversity with relevance using similarity metrics. Examples include DPPs, MMR, and submodular maximization models (Carbonell and Goldstein, 1998; Celis et al., 2018; Borodin et al., 2012). However, as noted by Celis et al. (2018), general visual similarity metrics (e.g. ImageNet pre-trained image embeddings) fail to generate diversity along attributes that contribute to people diversity, such as gender expression or skin tone.
To bridge this gap, several papers focus on diversifying image sets along attributes of people diversity that are socially salient (e.g. gender, skin tone, etc.). Karako and Manggala (2018) diversifies gender expression only by using a small set of gender expression-labeled images. Silva et al. (2023) uses attribute-specific classifiers — with a focus on skin tone — to diversify a large-scale recommendation system. Celis and Keswani (2020), on the other hand, move away from labeled attributes and attribute classifiers by using diverse hand-curated “control sets.” These control sets, however, do not generalize to new contexts and must be manually-designed for each new image set. As such, they cannot scale to ranking web systems that must quickly serve new image sets. Finally, Tanjim et al. (2022) address the problem of visual diversity by using GANs to generate image sets diverse in perceived gender and race, changing the problem setting from one of selecting diverse sets, to creating them from scratch.
Measuring the effect of these diversification schemes is also challenging, as the diversity of a group of people is inherently subjective: for instance, a person’s perception that a group is diverse can vary depending how their identities relate to the ones present in the group (Danbold and Unzueta, 2020). Obtaining human annotations on subjective tasks is a large area of research (Schumann et al., 2023; Goyal et al., 2022; Aroyo et al., 2023; Díaz et al., 2022). Much of this research shows the importance of diversity of the human annotators (Schumann et al., 2023; Goyal et al., 2022; Díaz et al., 2022) and notes the effects of subconscious biases and human inconsistency across time (Aroyo et al., 2023). Following Schumann et al. (2023), all human annotation tasks in this paper are completed by 8 annotators across 4 different geographical regions across the world.
Learning and Manipulating Embeddings.
The core methodological component of this work is learning and manipulating a new representation space (i.e. an embedding), a topic touched on by several strains of related research. One cornerstone of this work is leveraging pretrained image-text models such as CLIP (Radford et al., 2021) or CoCa (Yu et al., 2022a), where image and text features are aligned in a co-embedding space. A number of recent works probe these pretrained models for the structure and compositionality of representations in their embedding spaces (Lewis et al., 2022; Wolff et al., 2023; Zhou et al., 2023). For instance, Wolff et al. (2023) find using PCA on text embeddings to identify representations for attributes like color, size, patterns, yield a corresponding visual sub-space for the concepts. Zhou et al. (2023) are able to use PCA over a corpus of text embeddings to manipulate image embeddings along specific attributes of people.
This work is also influenced heavily by lines of work in the fairness literature which consider manipulating embeddings through removing specified information. The most similar works are linear concept removal (Bolukbasi et al., 2016; Ravfogel et al., 2022) which use a linear projection procedure to remove a single attribute (such as perceived gender expression) from a pretrained embedding. Chuang et al. (2023) also propose a projection-based approach, and further leverage an image-text co-embedding space to remove information about a single attribute. A more involved set of approaches are presented in the fair representation learning literature, in which methods attempt to learn an embedding from scratch while removing the influence of a sensitive attribute, either through an adversary (Madras et al., 2018; Edwards and Storkey, 2015) or regularization (Louizos et al., 2015; Song et al., 2019). PATHS also bears some similarities to approaches such as from Creager et al. (2019), who draws inspiration from the disentanglement literature to remove multiple attributes from an embedding simultaneously.
A small but growing literature considers using human annotations to learn representations directly. Notably, Andrews et al. (2023) have the most similar goals to this paper — they seek to produce a human-perception aligned embedding from human annotations of image triplets, while acknowledging the significant shortcomings in labeling human attributes or per-attribute classifiers for images. In order to make use of a limited amount of data, however, their images are restricted to cropped, frontal images of faces, which are a highly constrained domain and as such are less able to convey many attributes of diversity that are possible in the broad range of people images we are concerned with (full body, various poses and backgrounds), (e.g. cultural attire, body shape). Cui et al. (2016) also use human-in-the-loop annotations in metric learning to find a low-dimensional manifold (unrelated to diversity), sending high confidence examples for labelling and using them in the next round as either positives or hard negatives.
Finally, this work draws on the distance metric learning literature by using a triplet learning method to incorporate human perceptual feedback. Triplet learning has been successful in both linear metric learning approaches (Chechik et al., 2010; Mei et al., 2014), and deep learning-based methods (Hoffer and Ailon, 2015; Wang et al., 2014). There are also similar pair-based approaches in the classical metric learning literature, where pairs which are labelled as similar/dissimilar are brought closer/further in embedding space (Hadsell et al., 2006; Chopra et al., 2005).
3. Proposed method
This paper’s core contribution is a method for creating a representation space that can richly represent complex notions of people diversity, including attributes that are salient to real human annotators, without requiring numerous people attribute labels. This space is called the Perception-Aligned Text-derived Human representation Space (PATHS). Sections 3.1 and 3.2 describe these two stages involved in creating PATHS:
-
(1)
Text-guided subspace extraction: Starting with a pretrained image embedding, extract an embedding which contains only the person-diversity-relevant information.
-
(2)
Perception alignment: Refine the embedding so that images which are closer together contain people who are considered more perceptually-similar according to human judgment.
Finally, Section 3.3 describes how PATHS can be used to diversify an image ranking system (such as the one described in Celis and Keswani (2020)): we apply MMR (Carbonell and Goldstein, 1998), a standard diversification method, to select a set of images which are diverse within PATHS (additional evaluations of the space itself and any text datasets mentioned are provided in the Supplemental Materials).
3.1. Text-guided approach to extracting a person diversity subspace
| Linear Probes(AUC) | ||
|---|---|---|
| Text-derived Subspace | People | Non-people |
| Step 0: CoCa Embedding () | ||
| Step 1: People projection () | ||
| Step 2: Project out background () | ||
The cost of training a high-quality representation from scratch is prohibitive; we choose instead to start with CoCa text-image embeddings (Yu et al., 2022a), and perform two text-guided steps to extract a person-diversity representation, choosing CoCa as our starting point since it is trained on web-scale alt-text and annotated images and thus may already capture some notion of what humans notice about images. Recall that diversifying in the CoCa space directly would be too “broad” for diversification purposes; the first step in this method is therefore intended to narrow its scope to align more closely with person-diversity attributes.
Step 1: Project Onto People Attributes.
The high-level goal of this step is to find the subspace of the general image embedding that contains information which is relevant to people diversity. Once this subspace is found, the general embedding can be projected onto that subspace, called a “person-diversity representation”. If the subspace learning process is successful, it will contain a more narrow set of information about the image than the full embedding, but a broader set of human-related information than simply using perceived gender and skin tone labels.
To estimate this subspace without images or attribute labels, one can leverage CoCa’s multimodal nature (where an image of an object and a text description of that object are frequently close in embedding space) and instead use a text set of phrases referring to people. This text set is generated using Bard111https://bard.google.com/222For more details see Appendix J. as a set of 100 nouns referring to people (e.g. “bride” or “doctor”) and a set of adjectives applying to people across a range of diversity attributes (e.g. “gender-fluid” or “Buddhist”). For each noun, CoCa embeddings for all [adjective] + [noun] phrases are collected, and PCA was run on this set of embeddings, selecting the top components, where is just the target size of the projected embedding. Conceptualizing each individual noun’s embeddings as a noisy observation of the “person-diversity subspace”, the PCA components are averaged across all nouns to yield the projection matrix used to transform a CoCa embedding to a “person-diversity representation”.
To collect the “seed list” of diversity attributes, we hosted a focus group with 18 experts in diversity, machine learning fairness, and responsible AI with the goal of understanding what kinds of visualizable diversity attributes are important in image retrieval. The experts were asked to enumerate diversity attributes that they thought were important. They were then split into smaller groups to discuss the visualizability and language surrounding those attributes. This focus group agreed to prioritize the following attributes of diversity: perceived gender expression, body type, disability, nationality, age, religion, and perceived sexual orientation. Note that while this method does perform an enumeration of attributes in this step, the design process is much more flexible than standard alternatives in the literature: it does not require a taxonomy or weighting scheme across these attributes, nor does it need expensive individually annotated images. It is low-cost to add a new attribute, thereby encouraging more expansive representations of diversity.
Step 2: Project Out Background.
In theory, the previous step could successfully project out all non-people-diversity information from the embedding. However, in practice it is helpful to target a specific non-person attribute, background, in a second removal step. Mimicking the previous approach, a set of locations (e.g. “beach”, “office”, “outdoors”) were generated and systematically added these to the [adjective] + [noun] phrases (e.g “bride at the beach”). Similar to above, PCA is applied on the CoCa text embeddings of these phrases. The top components were selected to form a “background subspace” which was further projected out from the person-diversity representation, choosing . The final result of these two projection steps was , a linear transformation of the original CoCa image embedding (the product of two projection matrices) that projects to a “text-derived person diversity subspace”. See Appendix C for a discussion of hyperparameter tuning procedures used for .
![[Uncaptioned image]](extracted/5369235/figures/methods/tall_isoc.png)
|
|
||
|---|---|---|---|
|
|||
|
|||
![[Uncaptioned image]](extracted/5369235/figures/methods/scalene.png)
|
|
||
|
|||
|
|||
![[Uncaptioned image]](extracted/5369235/figures/methods/fat_isoc.png)
|
|
||
|
|||
|
3.2. Perception Alignment: Fine-tuned Representation using Human Perception
The previous projection step is intended to isolate as much of the relevant information as possible in the extracted representation; however, there is no guarantee that distances in this embedding space (derived from CoCa) correspond to human perceptions of similarity of the people contained. To this end, further fine-tuning was done by gathering human perceptions of people diversity333See Appendix E for a description of the human annotation task, and using them to learn a linear transformation.
3.2.1. Getting human perception annotations.
Each image triplet was annotated 4 times (once in each of the 4 regions), with annotators selecting the image containing the person they considered to be the most different. The annotators rated a dataset of 30k image tripets each, where 10k where sourced from the MIAP dataset (Schumann et al., 2021). To increase a) the number of images used for training and b) the diversity of people represented in the images, we source the next 20k image triplets from a separate scrape of Google Image Search with queries (not overlap** with the evaluation set) from the generated [adjective] + [noun] text phrases used to find the person diversity subspace.
3.2.2. Metric learning: Fine-tuning with human annotations
The goal is to learn a matrix, , that is intended to project the people-diversity representation into a space that better aligns with human perception. is trained with gradient descent on a modified triplet loss on the k human annotations obtained in the previous section (85%/10%/5% train-validation-test split). The final people-diversity representation — PATHS — for an image, , is given by .
Human annotations are used as the ground truth for the relative similarities between three images in a triplet: each of four annotators identifies the image that is most different from the other two as described in Sec 3.2. Table 2 describes the procedure for converting these four human annotations into relative similarities between images, letting denote the latent “ground truth” similarity between two images (Image and image ) based on the corresponding annotations.
Let the learned similarity function between two images be the Euclidean distance in embedding space, . One can attempt to enforce the inferred ground truth inequality (where defined, as in Table 2) between a pair of edges, and using a standard triplet loss with margin anchored at , the shared vertex (Chechik et al., 2010; Mei et al., 2014):
| (1) | ||||
The overall loss for an image triplet is then the sum of the three triplet losses, one anchored at each image:
| (2) | ||||
Since is being multiplied to produce the final embedding, the regularization happens against the identity matrix, .
3.3. Diverse Ranking
PATHS can be converted into a diverse ranking method by simply applying a diverse ranking algorithm to the learned PATHS space. We choose the simple Maximal Marginal Relevance (MMR) algorithm (Algorithm 1) to replicate the set-up from Celis and Keswani’s canonical work on the people-diversity task (Celis and Keswani, 2020).
Modern large-scale image ranking systems typically follow a retrieval stage, which reduces the number of candidate images from a large corpus (of millions) to a much smaller set. In our experiments, we simulate this stage by using evaluation sets of 100 images. These sets are described in section 4.1. After the retrieval stage, the 100 candidate images are ranked and MMR (Carbonell and Goldstein, 1998) is used to select the top 9 to display in a 3x3 grid.
The relevance score is the same as in Celis and Keswani (2020), simply the average cosine similarity of the image to the top 10 ranked images from the dataset using a general image embedding (Simonyan and Zisserman, 2014). Marginal diversity is the normalized Euclidean distance between the new image and the centroid of the existing top images in some representation space. Normalization is done to ensure that different values of have comparable effects for different representations of . Note that while MMR is an existing method, the core contribution of this work is the method for creating the people-diversity representation used to compute marginal diversity, and these representations could be used with diversification methods other than MMR.
4. Experimental Setup
4.1. Evaluation Datasets


To reiterate from the introduction, the goal is to diversify image sets in a way which is neither too narrow or too broad; specifically, to diversify along as many axes of sociocultural diversity of people as possible, while not to diversifying other aspects of non-people visual diversity. The dual goals recommend a specific evaluation setup, which leverages two contrasting datasets. The public Occupations dataset (Celis and Keswani, 2020) is used to test diversification along only features that people perceive as salient to people diversity, and not on non-people visual diversity. Additionally, we create a new dataset, the Diverse People Dataset (DPD), to test diversification along as many people-related attributes as possible. As described below, the two qualitatively different datasets complement each other well — overly-broad diversification methods should fail on Occupations, and overly-narrow diversification methods should fail on DPD. Together, they enable the identification of a diversification method that strikes the balance between overly narrow and overly broad diversification – capturing many different types of people-related diversity, without capturing irrelevant non-people related diversity. While image ranking is used in a variety of systems, we ground this evaluation in image recommendation: the datasets serve to simulate an image retrieval system and the task is to re-rank the images such that the top images are diverse.
Occupations Dataset:
Occupations is the canonical public baseline for the task of diversifying image sets of people. This dataset was created by scra** results from Google Image Search in 2020 for 96 occupations (such as custodian, paralegal, dentist, web developer) (Celis and Keswani, 2020). Images in this dataset often do not have people as the main focus: people often occupy a very small part of the total image or are present as drawings/clip art. While these images’ styles contribute to visual diversity, they don’t necessarily add to person-diversity. Additionally, though the dataset does have a fair amount of perceived gender expression and skin tone diversity, the dataset under-represents people from non-western cultural backgrounds, non-slim body types, and people with disabilities. It can be viewed as the results of a retrieval stage with low availability of diversity, and used to evaluate how a ranking method would perform in this setting. We use this dataset to measure whether a diversification method promotes people-diversity over more broad (people-unrelated) types of visual diversity. This task penalizes overly-broad diversification: due to the high amount of visual variation in the images that is non-people-related, a general diversification method will likely not improve people diversity. However, due to the small number of axes of people diversity represented (mostly perceived gender expression and skin tone), it is less able to assess whether a method has overly-narrow diversification – for this, the Diverse People Dataset is used.
Diverse People Dataset (DPD):
To evaluate how well the diversification method can surface many different kinds of people-diversity, we created the Diverse People Dataset (DPD) by scra** 100 queries on Google Image Search in May 2023. These queries were carefully chosen to match real searches by people in the US444Note that the US-centric nature of this query set is a limitation — see the Limitations section for more discussion., where the top 100 results were largely close-up images of people (e.g., “handsome man”). The 100 queries included references to roles (e.g ”family”, ”bride”), professions (e.g ”basketball player”, ”business person”), general terms for people (e.g. ”woman”, ”toddlers), descriptors (e.g ”funny person”, ”friendly person”), and fashion (e.g. ”bangs hairstyle”, ”country club outfits”).
Within each query, the top 80 images were scraped. Then a set of people attribute adjectives were added to each query (e.g., “handsome plus sized man” or “handsome elderly man”) to scrape an additional images with added people diversity. These attribute adjectives were chosen to cover a broad range of types of diversity, primarily covering the aspects of diversity identified as important by the focus group, while also yielding coherent high quality search results based on manual inspection. Note that this choice of sub-queries is one way to elicit sufficient diversity in the dataset, but there are many other viable choices as well. Additionally, a set of non-people attribute adjectives (e.g., “handsome man in a suit”) were added to scrape images that were more visually diverse, but irrelevant to people diversity — this visual diversity is still significantly less than that in the Occupations dataset, where frequently people are not even the focus of the image. The dataset of queries and their composition can be found in Appendix I. As this paper is grounded in the problem of ”diverse ranking”, and retrieval is outside of the scope of this paper, this dataset is used to comprehensively evaluate our ranking method by mocking a ”high diversity retrieval system” in which sub-queries are used to help identify diverse candidates.
As this dataset intentionally focuses on images where people are the primary subject of the photo, and where those people are diverse according to a wide range of attributes, it can evaluate a method’s ability to diversify many people-related features – that is whether the diversification method is broad enough. This dataset is less suitable to measure whether people-attributes are promoted over non-people attributes (for that we rely on the Occupations dataset).
4.2. Baseline Methods
PATHS is tested against a number of baselines: each defining a representation space to be used in MMR when calculating Marginal Diversity.
-
•
Random Baseline. A random baseline is used to demonstrate that the task is not trivially easy. Here MarginalDiversity is a random sample from a normal distribution. This baseline also serves as a sanity check for the human annotators annotating end to end diversity (Section 4.3); annotators should rate higher for increased people diversity, not merely for any image difference from base.
-
•
SkinTone + Perceived Gender Expression Baseline Much of the prior work in diversifying image sets of people focuses narrowly either on skin tone or perceived gender expression attributes of people. This baseline is used to understand the benefit of our more generalized person representation which does not list and classify people related attributes. For this baseline, a pretrained skin tone classifier and perceived gender expression classifier are used similar to those in Baruah et al. (2022). We turn each signal into a simple continuous float, and produce a two dimensional “skin tone + percevied gender expression” representation.
-
•
CoCa Raw Embedding To understand the added value of the text-guiding and human-alignment steps, another baseline is the original raw CoCa vision tower image embedding used as a starting point for PATHS (Yu et al., 2022a), which is expected to diversify broadly over all visual features.
- •
-
•
Perception-aligned Person-Diversity Representation Similarly, this baseline, created by only performing the perception-alignment step (Section 3.2) on the original CoCa image embedding is used to demonstrate the value of the text-guiding step (Section 3.1). Here the perception alignment learns a adapter matrix.
4.3. Evaluation metric: Annotated End-to-End Diversity
To evaluate the quality of the representation, 4 annotators, one per region, from a pool of 8 human annotators across four regions (Brazil, India, Ghana, and Philippines) were asked to annotate whether the top 9 images created by a method were more diverse from a person-centric socio-cultural perspective than the undiversified top 9 images. The undiversified set of 9 images are collected by ranking according to the relevance computation alone. Not every pair of methods were annotated to minimize evaluation annotation. Details about annotations can be found in Appendix E.
The annotators either rate the diversification method as yielded an image set “more diverse”, “equivalently diverse” or “less diverse” than the undiversified set. The main metric for evaluating the diversification is the net change in diversity; the net percentage of queries that have more diverse results (the percentage of sets rated more diverse - percentage rated less, or, equivalently, an aggregate score of +1 for more diverse, -1 for less, and 0 for neutral ratings).
5. Results
5.1. PATHS Improves Diversity over Both Narrow and Broad Methods
Tests on the contrasting Occupations and DPD datasets show that PATHS enables more ranking diversity improvement than both narrow baselines that only use skin tone and perceived gender expression signals, and broad baselines that are not people-specific (Table 3555While Figure 3 only shows net diversity change for a diversity weighting of against no diversification, full results for other diversity weights and a head-to-head comparison between PATHS and the skin tone and perceived gender expression baseline are included in Appendix B. ). On Occupations, the task that tests whether a representation promotes people-specific diversity over all general visual diversity (penalizing overly-broad approaches), PATHS beats all baseline methods by a large margin: , compared to for the SkinTone + Gender Expression baseline, and for the CoCa Embedding. We highlight that this improvement comes without the addition of costly attribute labels on people images, which prior literature tends to rely on to diversify more narrowly along skin tone and perceived gender. On the Diverse People Dataset, created to test whether a representation can diversify across many types of people diversity (penalizing overly-narrow approaches), PATHS also achieves among the best results: a diversity increase which is higher than the for the SkinTone + Gender Expression baseline, and close to the CoCa Embedding with . Overall, PATHS performs consistently well across both the ”low available diversity” retrieval setting replicated by the Occupations dataset, and the ”high available diversity” retrieval setting replicated by the Diverse People Dataset. An example of the end diversification achieved by PATHS is depicted in Figures 1 and 4, where PATHS promotes photos of traditional Chinese attire, and a woman in a wheelchair.
| Annotators prioritize gender expression over skin tone. | |||
|---|---|---|---|
|
Image A |
Image B |
Image C |
|
|
Gender Expression |
|||
|
Skin Tone |
|||
|
Annotators’ Consensus on Different Image |
of |
of |
of |
The CoCa embedding has starkly different diversity impacts on the two datasets: on Occupations and on Diverse People. This makes sense in context of each dataset. The Occupations dataset contain a large number of images which are visually diverse, but not demographically or culturally diverse. Here the lack of people-specificity in CoCa embeddings surfaces visually diverse, but not people-diverse images which reduces overall people diversity according to the human annotators. Diverse People Dataset, however, only contains images where a person occupies most of the image pixels, and it features many attributes of people diversity. Broad visual diversity correlates very strongly with people diversity due to the nature of this dataset.
Lastly, each of the two stages of PATHS alone — the text-derived only representation, and the perception-aligned only representation — do not perform as well as PATHS . The perception-aligned person diversity representation has particularly poor performance, and possible reasons for this is discussed in Section 6.
5.2. Human perception case studies
Past research often assumes that changes in perceived gender expression and skin tone affect perceived diversity equally (Karako and Manggala, 2018; Silva et al., 2023; Celis et al., 2018). We can interrogate this assumption using collected human perception data, showing that counter to this, annotators may believe changes in gender expression are more are more salient to people diversity than changes in skin tone (Table 3).
![[Uncaptioned image]](extracted/5369235/figures/examples/hijab_1_same1.jpg)
|
![[Uncaptioned image]](extracted/5369235/figures/examples/hijab_1_same2.jpeg)
|
![[Uncaptioned image]](extracted/5369235/figures/examples/hijab_1_diff.jpeg)
|
|
|---|---|---|---|
| Human Annotated | |||
| Most Different | 1 of 4 | 0 of 4 | 3 of 4 |
| Diversity Boost Given to Each Image During Ranking. | |||
| Most boosted image is bolded. | |||
| Raw CoCa | 2.863 | ||
| SkinTone + Gender | 0.053 | ||
| Perception-Aligned Only | 1.623 | ||
| Text-Derived Only | 1.714 | ||
| PATHS | |||
![[Uncaptioned image]](extracted/5369235/figures/examples/hijab_2_same1.jpeg)
|
![[Uncaptioned image]](extracted/5369235/figures/examples/hijab_2_same2.jpeg)
|
![[Uncaptioned image]](extracted/5369235/figures/examples/hijab_2_diff.jpeg)
|
|
|---|---|---|---|
| Human Annotated | |||
| Most Different | 0 of 4 | 0 of 4 | 4 of 4 |
| Diversity Boost Given to Each Image During Ranking. | |||
| Most boosted image is bolded. | |||
| Raw CoCa | 0.214 | ||
| SkinTone + Gender | -0.389 | ||
| Perception-Aligned Only | -0.281 | ||
| Text-Derived Only | 0.518 | ||
| PATHS | |||
Furthermore, this work finds that elements of cultural attire, such as the hijab, have an even greater impact on perceived diversity. In a study where 12 image triplets each contained one person wearing a hijab and two in Western attire, annotators across all four regions consistently rated the image with the individual wearing a hijab as the most different (methodology in Section 3.2.1).
Following up on this hijab effect, with a case study involving two new triplets (Table 4). The triplets contained images of two women with the same skin tone (one wearing a hijab, one not), and a third image of a woman with a different skin tone and no hijab. Even in this case, annotators strongly indicated that the presence or absence of a hijab contributed more to perceived difference than skin tone. Interestingly, only the PATHS diversification method accurately reflected this human preference, highlighting the importance of the perception-alignment step in our approach (and the sensitivity of this method to the cultural context of the annotators). Appendix F presents a similar case study with cultural bridal attire, leading to the same conclusions.
6. Discussion, Limitations, and Future work
Observation.
PATHS involves two steps: 1) a text-guided PCA approach to find an initial person-diversity representation, 2) fine-tuning with human annotations to align the representation to human perception. The results show that the perception alignment step alone (Section 3.2) is insufficient: without the text-guided step, it does not lead to substantial ranking diversity gains (Table 3) and does not help to capture human diversity preferences around cultural attire in qualitative explorations (Tables 4 and 10). This was surprising as both the perception alignment only method, and PATHS achieve similar test errors ( and respectively) in the human perception fine-tuning (Section 3.2.2).
We hypothesize three reasons why perception alignment by itself may not work well: sparse data, difficulty in selecting useful “hard” triplets, and the gap between pairwise difference judgements and set-level diversity judgements. When skip** the text-guiding step, parameters (a matrix) from only data points are learned, since one is learning a projection directly on the pretrained CoCa embedding. When using the text guiding PCA step, however, one only has to learn a matrix using human preference data, and can further regularize to be close to the identity matrix since the text-guided projection is already capable. This is more constrained problem space, and therefore easier to learn (more discussion on this point in Appendix D).
On hard triplet selection, PATHS mirrors older approaches used for person identification: this older work also uses metric learning only after pretraining a model with some surrogate model. Hermans et al. (2017) shows that metric learning alone can outperform other methods for person identification by selecting the most useful batch of “hard triplets” at each step. Given the importance of selecting the right triplets, perhaps a tighter feedback loop with human annotators to seek out the most useful “hard triplets” in each training step is needed for the the perception alignment only method to succeed. Lastly, in the three-in-a-row task, human raters compare three images to assess the most different one. In the final task, they assess the diversity of the image set as a whole. The triplet loss may be misaligned to the set-level diversity task and modeling set level judgement directly may help.
Limitations.
Though we ensured geographic diversity amongst our annotators, as we only used 8 annotators, we could not diversify across multiple dimensions e.g. self-identified gender, sexual orientation, body shape, education. Similarly, while the members of the focus group (Section 3.1) were experts in diversity, fairness, and responsible AI; and included diverse individuals belonging to the LGBTQ+ and BIPoC communities, they were primarily US-based with high levels of education. Both factors may lead to some important dimensions of diversity being ignored due to unconscious biases.
Both the Occupations dataset (Celis and Keswani, 2020) and the Diverse People Dataset are US-centric. The Occupations dataset is derived from occupations defined by the US Bureau of Labor and Statistics (Kay et al., 2015), and the Diverse People Dataset was created using search queries from people in the US. Future work should expand these sets to be more globally inclusive.
A limited amount of training data that was sent for annotation (30k). A larger training set could lead to improvements in the expressiveness and alignment of the person-diversity representation space. That being said, even with a larger collection of annotations, this annotation method would need significantly fewer annotations those needed to produce individual attribute classifiers used in the current diversification methods.
We were unable to fully reduce our test error on the perception-alignment finetuning step (See Appendix D), meaning we did not fully align to all perception preferences available, and better modeling methods may be needed.
Future Work.
As previous research has noted, annotations for subjective tasks are non-trivial to collect (Schumann et al., 2023; Goyal et al., 2022; Aroyo et al., 2023; Díaz et al., 2022). One approach involves adopting model architectures targeting individual annotators instead of overall consensus estimate (Chou and Lee, 2019; Davani et al., 2022; Hayat et al., 2022). While this could lead to confirmation bias bubbles (Ling, 2020), it is an interesting direction of research to retrieve a diverse set of images satisfying the user’s notion of diversity or the user’s identity. Another line of work could consider modeling diversity through exploring properties of image sets, whereas our paper which mainly considers image-to-image similarity (e.g. triplets, MMR). Considering image sets as a first-class element may capture complex diversity preferences that our method cannot (Section 5.2). In addition, this paper focuses primarily on image retrieval and ranking systems. In the future this work could be adapted to generated images of people (Lee et al., 2023; Friedrich et al., 2023; Cho et al., 2023).
7. Conclusion
Diversely ranking images of people is a challenging task, one that requires striking a balance in capturing the many attributes of people-diversity, while avoiding attributes of non-people visual diversity. Our new method, PATHS , accomplishes this balance better than past methods that narrowly focus on predefined people attributes, and better than methods that broadly diversify on all attributes of visual diversity. We find that our perception-alignment step, when combined with structure from the text-image space, also enables us to emphasize the types of people diversity that humans find to be most important (e.g. prioritizing salient cultural attire over differences in skin tone). There is still room for substantial future work. Nevertheless, this method will help enable ranking systems to embody richer, more flexible notions of visual people diversity by alleviating the need to prescriptively list and taxonomize people attributes or annotate photos of people.
References
- (1)
- Andrews et al. (2023) Jerone TA Andrews, Przemyslaw Joniak, and Alice Xiang. 2023. A View From Somewhere: Human-Centric Face Representations. arXiv preprint arXiv:2303.17176 (2023).
- Aroyo et al. (2023) Lora Aroyo, Mark Diaz, Christopher Homan, Vinodkumar Prabhakaran, Alex Taylor, and Ding Wang. 2023. The Reasonable Effectiveness of Diverse Evaluation Data. arXiv preprint arXiv:2301.09406 (2023).
- Ashkanasy et al. (2002) Neal M Ashkanasy, Charmine EJ Härtel, and Catherine S Daus. 2002. Diversity and emotion: The new frontiers in organizational behavior research. Journal of management 28, 3 (2002), 307–338.
- Baruah et al. (2022) Sabyasachee Baruah, Digbalay Bose, Meredith Conroy, Shrikanth S. Narayanan, Susanna Ricco, Komal Singh, and Krishna Somandepalli. 2022. #SeeItBeIt: What Families are Seeing on TV. The Geena Davis Institute on Gender in Media.
- Bolukbasi et al. (2016) Tolga Bolukbasi, Kai-Wei Chang, James Y Zou, Venkatesh Saligrama, and Adam T Kalai. 2016. Man is to computer programmer as woman is to homemaker? debiasing word embeddings. Advances in neural information processing systems 29 (2016).
- Borodin et al. (2012) Allan Borodin, Hyun Chul Lee, and Yuli Ye. 2012. Max-sum diversification, monotone submodular functions and dynamic updates. In Proceedings of the 31st ACM SIGMOD-SIGACT-SIGAI symposium on Principles of Database Systems. 155–166.
- Carbonell and Goldstein (1998) Jaime Carbonell and Jade Goldstein. 1998. The use of MMR, diversity-based reranking for reordering documents and producing summaries. In Proceedings of the 21st annual international ACM SIGIR conference on Research and development in information retrieval. 335–336.
- Celis et al. (2018) Elisa Celis, Vijay Keswani, Damian Straszak, Amit Deshpande, Tarun Kathuria, and Nisheeth Vishnoi. 2018. Fair and diverse DPP-based data summarization. In International conference on machine learning. PMLR, 716–725.
- Celis et al. (2016) L Elisa Celis, Amit Deshpande, Tarun Kathuria, and Nisheeth K Vishnoi. 2016. How to be fair and diverse? arXiv preprint arXiv:1610.07183 (2016).
- Celis and Keswani (2020) L Elisa Celis and Vijay Keswani. 2020. Implicit diversity in image summarization. Proceedings of the ACM on Human-Computer Interaction 4, CSCW2 (2020), 1–28.
- Chechik et al. (2010) Gal Chechik, Varun Sharma, Uri Shalit, and Samy Bengio. 2010. Large scale online learning of image similarity through ranking. Journal of Machine Learning Research 11, 3 (2010).
- Cho et al. (2023) Jaemin Cho, Abhay Zala, and Mohit Bansal. 2023. DALL-Eval: Probing the Reasoning Skills and Social Biases of Text-to-Image Generation Models. In Proceedings of the IEEE/CVF International Conference on Computer Vision. 3043–3054.
- Chopra et al. (2005) Sumit Chopra, Raia Hadsell, and Yann LeCun. 2005. Learning a similarity metric discriminatively, with application to face verification. In 2005 IEEE computer society conference on computer vision and pattern recognition (CVPR’05), Vol. 1. IEEE, 539–546.
- Chou and Lee (2019) Huang-Cheng Chou and Chi-Chun Lee. 2019. Every rating matters: Joint learning of subjective labels and individual annotators for speech emotion classification. In ICASSP 2019-2019 IEEE International Conference on Acoustics, Speech and Signal Processing (ICASSP). IEEE, 5886–5890.
- Chuang et al. (2023) Ching-Yao Chuang, Varun Jampani, Yuanzhen Li, Antonio Torralba, and Stefanie Jegelka. 2023. Debiasing vision-language models via biased prompts. arXiv preprint arXiv:2302.00070 (2023).
- Creager et al. (2019) Elliot Creager, David Madras, Jörn-Henrik Jacobsen, Marissa Weis, Kevin Swersky, Toniann Pitassi, and Richard Zemel. 2019. Flexibly fair representation learning by disentanglement. In International conference on machine learning. PMLR, 1436–1445.
- Cui et al. (2016) Yin Cui, Feng Zhou, Yuanqing Lin, and Serge Belongie. 2016. Fine-grained categorization and dataset bootstrap** using deep metric learning with humans in the loop. In Proceedings of the IEEE conference on computer vision and pattern recognition. 1153–1162.
- Danbold and Unzueta (2020) Felix Danbold and Miguel M Unzueta. 2020. Drawing the diversity line: Numerical thresholds of diversity vary by group status. Journal of Personality and Social Psychology 118, 2 (2020), 283.
- Davani et al. (2022) Aida Mostafazadeh Davani, Mark Díaz, and Vinodkumar Prabhakaran. 2022. Dealing with disagreements: Looking beyond the majority vote in subjective annotations. Transactions of the Association for Computational Linguistics 10 (2022), 92–110.
- de Freitas et al. (2018) Catarina de Freitas, Helen Jordan, and Elizabeth K Hughes. 2018. Body image diversity in the media: A content analysis of women’s fashion magazines. Health Promotion Journal of Australia 29, 3 (2018), 251–256.
- Deng et al. (2009) Jia Deng, Wei Dong, Richard Socher, Li-Jia Li, Kai Li, and Li Fei-Fei. 2009. Imagenet: A large-scale hierarchical image database. In 2009 IEEE conference on computer vision and pattern recognition. Ieee, 248–255.
- Denton et al. (2021) Emily Denton, Alex Hanna, Razvan Amironesei, Andrew Smart, and Hilary Nicole. 2021. On the genealogy of machine learning datasets: A critical history of ImageNet. Big Data & Society 8, 2 (2021), 20539517211035955.
- Díaz et al. (2022) Mark Díaz, Ian Kivlichan, Rachel Rosen, Dylan Baker, Razvan Amironesei, Vinodkumar Prabhakaran, and Emily Denton. 2022. CrowdWorkSheets: Accounting for Individual and Collective Identities Underlying Crowdsourced Dataset Annotation. In 2022 ACM Conference on Fairness, Accountability, and Transparency (Seoul, Republic of Korea) (FAccT ’22). Association for Computing Machinery, New York, NY, USA, 2342–2351. https://doi.org/10.1145/3531146.3534647
- Edwards and Storkey (2015) Harrison Edwards and Amos Storkey. 2015. Censoring representations with an adversary. arXiv preprint arXiv:1511.05897 (2015).
- Friedrich et al. (2023) Felix Friedrich, Patrick Schramowski, Manuel Brack, Lukas Struppek, Dominik Hintersdorf, Sasha Luccioni, and Kristian Kersting. 2023. Fair diffusion: Instructing text-to-image generation models on fairness. arXiv preprint arXiv:2302.10893 (2023).
- Ghumman et al. (2013) Sonia Ghumman, Ann Marie Ryan, Lizabeth A Barclay, and Karen S Markel. 2013. Religious discrimination in the workplace: A review and examination of current and future trends. Journal of Business and Psychology 28 (2013), 439–454.
- Goyal et al. (2022) Nitesh Goyal, Ian D. Kivlichan, Rachel Rosen, and Lucy Vasserman. 2022. Is Your Toxicity My Toxicity? Exploring the Impact of Rater Identity on Toxicity Annotation. Proc. ACM Hum.-Comput. Interact. 6, CSCW2, Article 363 (nov 2022), 28 pages. https://doi.org/10.1145/3555088
- Hadsell et al. (2006) Raia Hadsell, Sumit Chopra, and Yann LeCun. 2006. Dimensionality reduction by learning an invariant map**. In 2006 IEEE computer society conference on computer vision and pattern recognition (CVPR’06), Vol. 2. IEEE, 1735–1742.
- Hayat et al. (2022) Hassan Hayat, Carles Ventura, and Agata Lapedriza. 2022. Modeling Subjective Affect Annotations with Multi-Task Learning. Sensors 22, 14 (2022). https://doi.org/10.3390/s22145245
- Hermans et al. (2017) Alexander Hermans, Lucas Beyer, and Bastian Leibe. 2017. In Defense of the Triplet Loss for Person Re-Identification. arXiv:1703.07737 [cs.CV]
- Hoffer and Ailon (2015) Elad Hoffer and Nir Ailon. 2015. Deep metric learning using triplet network. In Similarity-Based Pattern Recognition: Third International Workshop, SIMBAD 2015, Copenhagen, Denmark, October 12-14, 2015. Proceedings 3. Springer, 84–92.
- Jackson et al. (2003) Susan E Jackson, Aparna Joshi, and Niclas L Erhardt. 2003. Recent research on team and organizational diversity: SWOT analysis and implications. Journal of management 29, 6 (2003), 801–830.
- **g and Baluja (2008) Yushi **g and Shumeet Baluja. 2008. Visualrank: Applying pagerank to large-scale image search. IEEE Transactions on Pattern Analysis and Machine Intelligence 30, 11 (2008), 1877–1890.
- Karako and Manggala (2018) Chen Karako and Putra Manggala. 2018. Using image fairness representations in diversity-based re-ranking for recommendations. In Adjunct Publication of the 26th Conference on User Modeling, Adaptation and Personalization. 23–28.
- Kay et al. (2015) Matthew Kay, Cynthia Matuszek, and Sean A Munson. 2015. Unequal representation and gender stereotypes in image search results for occupations. In Proceedings of the 33rd annual acm conference on human factors in computing systems. 3819–3828.
- Kunze et al. (2011) Florian Kunze, Stephan A Boehm, and Heike Bruch. 2011. Age diversity, age discrimination climate and performance consequences—a cross organizational study. Journal of organizational behavior 32, 2 (2011), 264–290.
- Lee et al. (2023) Kimin Lee, Hao Liu, Moonkyung Ryu, Olivia Watkins, Yuqing Du, Craig Boutilier, Pieter Abbeel, Mohammad Ghavamzadeh, and Shixiang Shane Gu. 2023. Aligning text-to-image models using human feedback. arXiv preprint arXiv:2302.12192 (2023).
- Lewis et al. (2022) Martha Lewis, Qinan Yu, Jack Merullo, and Ellie Pavlick. 2022. Does clip bind concepts? probing compositionality in large image models. arXiv preprint arXiv:2212.10537 (2022).
- Lindqvist et al. (2021) Anna Lindqvist, Marie Gustafsson Sendén, and Emma A Renström. 2021. What is gender, anyway: a review of the options for operationalising gender. Psychology & sexuality 12, 4 (2021), 332–344.
- Ling (2020) Rich Ling. 2020. Confirmation bias in the era of mobile news consumption: the social and psychological dimensions. Digital Journalism 8, 5 (2020), 596–604.
- Louizos et al. (2015) Christos Louizos, Kevin Swersky, Yujia Li, Max Welling, and Richard Zemel. 2015. The variational fair autoencoder. arXiv preprint arXiv:1511.00830 (2015).
- Madras et al. (2018) David Madras, Elliot Creager, Toniann Pitassi, and Richard Zemel. 2018. Learning adversarially fair and transferable representations. In International Conference on Machine Learning. PMLR, 3384–3393.
- Mehrab Tanjim et al. (2022) Md Mehrab Tanjim, Ritwik Sinha, Krishna Kumar Singh, Sridhar Mahadevan, David Arbour, Moumita Sinha, and Garrison W. Cottrell. 2022. Generating and Controlling Diversity in Image Search. In 2022 IEEE/CVF Winter Conference on Applications of Computer Vision (WACV). 3908–3916. https://doi.org/10.1109/WACV51458.2022.00396
- Mei et al. (2014) Jiangyuan Mei, Meizhu Liu, Hamid Reza Karimi, and Huijun Gao. 2014. Logdet divergence-based metric learning with triplet constraints and its applications. IEEE Transactions on Image Processing 23, 11 (2014), 4920–4931.
- Noble (2018) Safiya Umoja Noble. 2018. Algorithms of Oppression. NYU Press.
- Otterbacher et al. (2018) Jahna Otterbacher, Alessandro Checco, Gianluca Demartini, and Paul Clough. 2018. Investigating user perception of gender bias in image search: the role of sexism. In The 41st International ACM SIGIR conference on research & development in information retrieval. 933–936.
- Plaut et al. (2015) Victoria C Plaut, Sapna Cheryan, and Flannery G Stevens. 2015. New frontiers in diversity research: Conceptions of diversity and their theoretical and practical implications. (2015).
- Prabhu and Birhane (2020) Vinay Uday Prabhu and Abeba Birhane. 2020. Large image datasets: A pyrrhic win for computer vision? arXiv preprint arXiv:2006.16923 (2020).
- Qian et al. (2017) Xueming Qian, Dan Lu, Yaxiong Wang, Li Zhu, Yuan Yan Tang, and Meng Wang. 2017. Image re-ranking based on topic diversity. IEEE Transactions on Image Processing 26, 8 (2017), 3734–3747.
- Radford et al. (2021) Alec Radford, Jong Wook Kim, Chris Hallacy, Aditya Ramesh, Gabriel Goh, Sandhini Agarwal, Girish Sastry, Amanda Askell, Pamela Mishkin, Jack Clark, et al. 2021. Learning transferable visual models from natural language supervision. In International conference on machine learning. PMLR, 8748–8763.
- Rattan and Ambady (2013) Aneeta Rattan and Nalini Ambady. 2013. Diversity ideologies and intergroup relations: An examination of colorblindness and multiculturalism. European Journal of Social Psychology 43, 1 (2013), 12–21.
- Ravfogel et al. (2022) Shauli Ravfogel, Michael Twiton, Yoav Goldberg, and Ryan D Cotterell. 2022. Linear adversarial concept erasure. In International Conference on Machine Learning. PMLR, 18400–18421.
- Reeves et al. (2012) Terrie C Reeves, Arlise P McKinney, and Laila Azam. 2012. Muslim women’s workplace experiences: Implications for strategic diversity initiatives. Equality, Diversity and Inclusion: An International Journal 32, 1 (2012), 49–67.
- Schumann et al. (2023) Candice Schumann, Gbolahan O Olanubi, Auriel Wright, Ellis Monk Jr, Courtney Heldreth, and Susanna Ricco. 2023. Consensus and Subjectivity of Skin Tone Annotation for ML Fairness. arXiv preprint arXiv:2305.09073 (2023).
- Schumann et al. (2021) Candice Schumann, Susanna Ricco, Utsav Prabhu, Vittorio Ferrari, and Caroline Pantofaru. 2021. A step toward more inclusive people annotations for fairness. In Proceedings of the 2021 AAAI/ACM Conference on AI, Ethics, and Society. 916–925.
- Silva et al. (2023) Pedro Silva, Bhawna Juneja, Shloka Desai, Ashudeep Singh, and Nadia Fawaz. 2023. Representation Online Matters: Practical End-to-End Diversification in Search and Recommender Systems. In Proceedings of the 2023 ACM Conference on Fairness, Accountability, and Transparency. 1735–1746.
- Simonyan and Zisserman (2014) Karen Simonyan and Andrew Zisserman. 2014. Very deep convolutional networks for large-scale image recognition. arXiv preprint arXiv:1409.1556 (2014).
- Song et al. (2019) Jiaming Song, Pratyusha Kalluri, Aditya Grover, Shengjia Zhao, and Stefano Ermon. 2019. Learning controllable fair representations. In The 22nd International Conference on Artificial Intelligence and Statistics. PMLR, 2164–2173.
- Tanjim et al. (2022) Md Mehrab Tanjim, Ritwik Sinha, Krishna Kumar Singh, Sridhar Mahadevan, David Arbour, Moumita Sinha, and Garrison W Cottrell. 2022. Generating and controlling diversity in image search. In Proceedings of the IEEE/CVF Winter Conference on Applications of Computer Vision. 411–419.
- Van Leuken et al. (2009) Reinier H Van Leuken, Lluis Garcia, Ximena Olivares, and Roelof Van Zwol. 2009. Visual diversification of image search results. In Proceedings of the 18th international conference on World wide web. 341–350.
- Wang et al. (2014) Jiang Wang, Yang Song, Thomas Leung, Chuck Rosenberg, **gbin Wang, James Philbin, Bo Chen, and Ying Wu. 2014. Learning fine-grained image similarity with deep ranking. In Proceedings of the IEEE conference on computer vision and pattern recognition. 1386–1393.
- Wang et al. (2012) Meng Wang, Hao Li, Dacheng Tao, Ke Lu, and Xindong Wu. 2012. Multimodal graph-based reranking for web image search. IEEE transactions on image processing 21, 11 (2012), 4649–4661.
- Wolff et al. (2023) Max Wolff, Wieland Brendel, and Stuart Wolff. 2023. The Independent Compositional Subspace Hypothesis for the Structure of CLIP’s Last Layer. In ICLR 2023 Workshop on Mathematical and Empirical Understanding of Foundation Models.
- Wu et al. (2020) Wenying Wu, Pavlos Protopapas, Zheng Yang, and Panagiotis Michalatos. 2020. Gender classification and bias mitigation in facial images. In Proceedings of the 12th ACM Conference on Web Science. 106–114.
- Yang et al. (2020) Kaiyu Yang, Klint Qinami, Li Fei-Fei, Jia Deng, and Olga Russakovsky. 2020. Towards fairer datasets: Filtering and balancing the distribution of the people subtree in the imagenet hierarchy. In Proceedings of the 2020 conference on fairness, accountability, and transparency. 547–558.
- Yu et al. (2014) Jun Yu, Dacheng Tao, Meng Wang, and Yong Rui. 2014. Learning to rank using user clicks and visual features for image retrieval. IEEE transactions on cybernetics 45, 4 (2014), 767–779.
- Yu et al. (2022a) Jiahui Yu, Zirui Wang, Vijay Vasudevan, Legg Yeung, Mojtaba Seyedhosseini, and Yonghui Wu. 2022a. Coca: Contrastive captioners are image-text foundation models. arXiv preprint arXiv:2205.01917 (2022).
- Yu et al. (2022b) Jiahui Yu, Yuanzhong Xu, **g Yu Koh, Thang Luong, Gunjan Baid, Zirui Wang, Vijay Vasudevan, Alexander Ku, Yinfei Yang, Burcu Karagol Ayan, et al. 2022b. Scaling autoregressive models for content-rich text-to-image generation. arXiv preprint arXiv:2206.10789 2, 3 (2022), 5.
- Zhou et al. (2023) Chenliang Zhou, Fangcheng Zhong, and Cengiz Öztireli. 2023. CLIP-PAE: Projection-Augmentation Embedding to Extract Relevant Features for a Disentangled, Interpretable and Controllable Text-Guided Face Manipulation. In ACM SIGGRAPH 2023 Conference Proceedings. 1–9.
Appendix A Qualitative Evals
Figure 4 depicts end to end ranking results for three treatments for the query “bride”: no diversification, the skin tone and gender expression baseline, and PATHS. PATHS promotes two images: a photo of a bride in different cultural attire, and a photo of a disabled bride. The skin tone and gender expression baseline promotes an image of a black bride surrounded by a wedding party. Here, we see that the gender component of this baseline creates an odd artifact and causes us to surface images that also have more men for the query “bride.”


Appendix B Results on other alpha values for diversity. Results for head to head comparison of skin tone + gender against PATHS.
Table 5 contains the increase in diversity for all methods, across both datasets, for all settings of . The text-derived representations, both text-derived only and PATHS, lose some of the people-related information from CoCa (Table 1). As such, they perform similarly or slightly worse than the raw CoCa in the Diverse People task, but still much better than the SkinTone + Gender or Random baselines that do not have information about other types of people diversity. In general, looking across results, PATHS most consistently increases the diversity by a large amount (always ¿38% increase). Figure 5 shows the full breakdown of ratings where ”wins” are where the diversification method’s side was rated as more diverse, ”neutral” was both sides were rated equally diverse, and ”loss” is where the diversification method’s side was rated as less diverse. Table 6 has the head to head comparisons of PATHS against the Skin tone + gender expression baseline and against our text-derived representation space. PATHS overall increases diversity over the skin tone and gender expression baseline. The gap between PATHS and the text-derived representation space is smaller, and more inconsistent, with PATHS generally scoring slightly better.
| Net Diversity Improvement ( is better) for | |||
| Diversification | (% Queries Improved - % Queries Worsened) | ||
| Treatment | Occupations Dataset | Diverse People Dataset | Avg. Across Datasets |
| Random Baseline | |||
| SkinTone + Gender Expression Baseline | |||
| CoCa Image Embedding | |||
| Our Methods: | |||
| Text-derived Representation Space | |||
| Perception-aligned Representation Space | |||
| PATHS | |||
| For | |||
| Diversification | |||
| Treatment | Occupations Dataset | Diverse People Dataset | Avg. Across Datasets |
| Random Baseline | |||
| SkinTone + Gender Expression Baseline | |||
| CoCa Image Embedding | |||
| Our Methods: | |||
| Text-derived Representation Space | |||
| Perception-aligned Representation Space | |||
| PATHS | |||


| Net Diversity Improvement ( is better) for | |||
| Comparison | (% Queries Improved - % Queries Worsened) | ||
| Treatment | Occupations Dataset | Diverse People Dataset | Avg. Across Datasets |
| SkinTone + Gender Expression Baseline | |||
| Text-derived Representation Space | |||
| Net Diversity Improvement ( is better) for | |||
| Comparison | (% Queries Improved - % Queries Worsened) | ||
| Treatment | Occupations Dataset | Diverse People Dataset | Avg. Across Datasets |
| SkinTone + Gender Expression Baseline | |||
| Text-derived Representation Space | |||
| Net Diversity Improvement ( is better) for | |||
| Comparison | (% Queries Improved - % Queries Worsened) | ||
| Treatment | Occupations Dataset | Diverse People Dataset | Avg. Across Datasets |
| SkinTone + Gender Expression Baseline | |||
| Text-derived Representation Space | |||
Appendix C Linear Probe Evaluations

Here we describe how we use a linear evaluation task as a heuristic for hyperparameter selection when choosing the values for (the number of PCA components we use when extracting the person diversity representation space initially from the CoCa embedding) and (the number of PCA components we use when projecting out information about the background from this initially extracted subspace) as defined in Sec. 3.1. This also functions as a sanity check for the quality of the person-diversity representation. We design a set of people-related and non-people related binary image classification tasks. Each task is defined by a set of queries (e.g. “female doctor”, “male doctor” or “American dancer”, “Indian dancer”, “Ghanaian dancer”, “walking indoors”, “walking outdoors”) — for each of these queries we scrape a set of images from Google Image Search; the task is then a -way classification problem, of distinguishing the sets of images from each other. For each query set, we have some expectation around what the discriminative signal will be: for instance, in the “female/male doctor” task we expect the classification model will have to pick up on a signal around perceived gender expression in order to perform well, and in the “American/Indian/Ghanaian dancer” task, we expect the relevant signal will have something to do with cultural presentation. In contrast, we expect the discriminative signal in the “walking indoors/outdoors” task will be unrelated to people — we would call this a non-people-related task, and the tasks described previously to be people-related tasks 666Note that this does not mean we expect to be doing effective classification of percevied gender expression or culture per se; rather, we use this as a quick evaluation heuristic to estimate if the people-diversity representation responds more to signals which are likely people-related than those which are likely non-people-related..
For each task, we learn a simple linear layer on top of the existing people-diversity representations. Ideally, the people-diversity representation performs well on the person-related tasks and poorly on the non-person tasks. Table 1 summarizes the results of these evaluations for the candidate people-diversity representation. We ran a sweep across values of and compared performance on these linear evaluations, and chose , i.e. a 12 dimensional PCA-derived people-diversity representation with 3 dimensions of the “person-background” subspace projected out, which seemed to present the best tradeoff between high performance on the people tasks, low performance on non-people tasks, and small representation size. The final candidate is a 12 dimensional PCA-derived people-diversity representation with 3 dimensions of the “person-background” subspace projected out. The result is , a linear transformation of the original CoCa image embedding that projects to a “text-derived person diversity subspace.”
In Fig. 6, we show the results of our hyperparameter sweep over and . Our evaluation method is to train a linear model to predict which image corresponds to which query (e.g. “female doctor” vs “male doctor”). The X-axis shows the performance of a linear model trained on the embedding on non-person tasks, and the Y-axis shows this for person tasks (averaged across tasks in both cases) — we ideally want our model to perform well on person tasks, and poorly on non-person tasks. For example, in the top right hand corner is the point representing the full CoCa embedding, which has high performance on both person and non-person tasks — all other options are worse on both task groups. We see that there are many viable choices which sit on various points across the tradeoff between these two, represented by various circles on the plot. We show with triangles and darker circles the options we decided presented the best points along this tradeoff — we picked these since they seemed to sit at an “elbow” point where the tradeoff was slightly better, as shown by distance from the black diagonal (representing equal performance on the two task groups).
Appendix D Learning from Human Annotations on Triplets
In this section we’ll present and discuss the training set-up to incorporate human perception results, in the “perception-alignment” phase described in Section 3.2.2.
We learned a simple linear matrix transformation in all cases, using all human annotations shuffled together. The batch size was , number of steps , with a validation step performed every steps. We used an Adam Optimizer with learning rate and momentum . The margin on the triplet loss ( in Equation 1) was set to .
We compute error on a per triplet basis: a triplet is correct, iff all the desired relative similarities (There are 2-3 per triplet as described in Table 2) are correctly enforced. The starting and ending test errors for the perception alignment only and PATHS approaches are depicted in Table 7.
All approaches have the same (high) test error post-fine tuning. This is true even through the perception alignment only method starting with a much lower test error (This method starts by passing in the top 12 rows of the original CoCa embedding). Surprisingly then, PATHS clearly outperforms perception alignment alone on end-to-end diversity impact, as demonstrated in Figures LABEL:fig:sxs_occ and LABEL:fig:sxs_pdcd. It’s clear that the test error on this individual triplet task correlates somewhat poorly with the end Diversity Impact, but it is unclear why. Likely, this task’s error correlates poorly with end Diversity Impact simply perhaps because even this task’s error is still so high at the end of fine-tuning. Furthermore to explain why the additive PATHS performs so much worse than the projection approach (columns 3 and 2 of Table 7 respectively), we hypothesize that with the relatively sparse data available, we’re not able to learn many parameters.
| Perception Alignment Only | PATHS : Multiplication Version | PATHS : Additive Version | |
|---|---|---|---|
| (No text-guiding step) | (Version used in Paper) | (Not used in Paper) | |
|
Dimension of Learned Matrix, |
|||
|
How to compute embedding, |
|||
|
Matrix regularized against for L1, L2 Loss |
|||
|
L1 Loss Weight |
|||
|
L2 Loss Weight |
|||
|
Test Error Before Fine-tuning |
|||
|
Test Error After Fine-tuning |
Appendix E Human Annotations
Research has shown the importance of annotator diversity when performing subjective annotation tasks (Schumann et al., 2023; Goyal et al., 2022; Díaz et al., 2022). Therefore, following Schumann et al. (2023), we hired 8 annotators evenly spread across 4 regions: Brazil, Ghana, India, and the Philippines.
We first tested three methods of getting annotations to identify which method was best at measuring the general people diversity in images. The first method was pairwise annotation, in which annotators would be asked to view a target image and annotate the extent to which the paired image was different from the target image on a 3-point scale (see Appendix E). The second method we considered was triplet annotation, in which annotators would view a target image and two more images, Image A and Image B, and select which of these two images were more different from the target image (see Appendix E). The third method we considered was three-in-a-row annotation, in which annotators would view three images, Image A, Image B, and Image C, and select which of the three images most the most different of the set (see Appendix E). The image sets used to test the three methods were selected to include both easy examples, which had clear ”correct” answers, and hard examples, where there is no clear ”correct” answer. These two type of sets allow us to a) understand if the annotators are able to perform the task correctly and b) look at consensus across hard examples.
Of the three methods, we selected three-in-a-row for our model development. The three methods had similar amounts of “accuracy” — agreement between annotators and our internal team — but the three-in-a-row had the highest rater consensus and the highest rate of 100% agreement between annotators. For the full details on our annotation method selection see the appendix E.
In our initial examination we sent a test set of 30 comparisons in each condition to the group of eight annotators, two from India, Brazil, Ghana, and Philippines. One limitation of our test was that annotators saw the same images, presented randomly, across the annotation conditions. In consideration of order effects, where practice might improve performance over time, we split the eight annotators into two groups of four with one annotator from each region. Group One saw three-in-a-row, then pairwise, then triplets, and Group Two saw triplet, pairwise, three-in-a-row. In determining which method to use we considered the relative accuracy of the methods and the consistency in annotation among annotators.
There were eighteen trials in which there were clear “right” answers as defined by the team of authors. Across methods we found a similar amount of accuracy for these items. In triplets and three-in-a-row annotators would select the correct image as most different. In pairwise the average difference in the paired image would be greater for the “right” answer. Across annotation methods there were similar rates of accuracy. Given these similar rates of accuracy (Table 8) we focused on consistency among annotators when selecting which method to use for model development.
| Three-in-a-Row | Pairwise | Triplet | |
|---|---|---|---|
| Group 1 | 15/18 | 16/18 | 18/18 |
| Group 2 | 18/18 | 17/18 | 17/18 |
For consensus among annotators we considered the whole set of 30 test questions, 18 questions with “right” answers and 12 questions with no-clear answer when considering which method to use for annotation. Pairwise performed the worse when it came to consensus - in part because the method might be too sensitive to differences in how the annotators may use the 3-point scale. For example, in one pairwise case where expected there to be no differences, two outwardly similar feminine presenting women, only two annotators across Group One and Group Two selected “No Different” when comparing the two images. Suggestive of an over-sensitive measure, five of the annotators selected “Somewhat Different” noting features like hair color or uniform color, and one annotator selected “Very Different” (although this may have been in error as they noted the two people had similar age and gender expressions). This also highlighted an issue of interpretability across different comparisons, in the example above an annotator rated both the top comparisons, two outwardly similar feminine presenting women, and the bottom comparison, one feminine presenting women and one masculine presenting man, as “somewhat different” similarly weighting the difference between uniform color and gender expression. Although this might have been one case of misuse of the annotation scale, we decided not to move forward with pairwise because of a greater number of potential issues with consensus, over-sensitivity, and the interoperability of the annotations.
When comparing triplet and three-in-a-row annotations we paid special attention to the order in which annotators used the various methods. Group One saw triplets last and Group Two saw three-in-a-row last, suggesting they had the most practice prior to completing these condition. Generally, we found similar rates of consensus across methods even when considering the order in which annotators were exposed to the various conditions (Table 9). However, Group Two’s three-in-a-row performance stood out. Not only did they have the highest rate of consensus on the test set, but the highest rate of 100% agreement among the annotators. This was particularly interesting because three-in-a-row is a three-choice paradigm where triplets are a two-choice paradigm, suggesting that despite the higher chance for disagreement annotators are performing better on this more difficult task. Thus, we decided to leverage the three-in-a-row method of annotators for the general diversity ratings.
| Group 1 | Group 2 | |
|---|---|---|
| Triplet | *83.33% (saw 2nd) | 85% (saw 1st) |
| Three-in-a-Row | 84.17% (saw 1st) | *90.83% (saw 2nd) |
E.1. Human Annotation Templates
Human annotators used the following templates for annotation tasks.
For the side-by-side diversity template, which set of images appeared on the left vs the right was randomized.


Appendix F Additional Case Study: Cultural Wedding Dresses
This additional case study on photos of brides from different cultures highlights the type of diversity gains we see due to the human-alignment step of PATHS . In Table 10 we see that human annotators believe that a person wearing bridal attire from a different culture makes the person more different than a person of a different skin tone wearing bridal attire from the same culture. This human preference is captured in PATHS , which has both text-guiding and human-aligning steps. Raw CoCa embedding also gets the second example right, though in the second example the backdrop and overall visual difference of the third image of the Chinese bride is also greatest — i.e. it’s unclear whether the raw CoCa gets the example right due to the people diversity or the backdrop and lighting diversity.
![[Uncaptioned image]](extracted/5369235/figures/bride_1_same1.png)
|
![[Uncaptioned image]](extracted/5369235/figures/bride_1_same2.png)
|
![[Uncaptioned image]](extracted/5369235/figures/bride_1_diff.png)
|
|
|---|---|---|---|
| Human Annotated | |||
| Most Different | 0 of 4 | 0 of 4 | 4 of 4 |
| Diversity Boost Given to Each Image During Ranking. | |||
| Most boosted image is bolded. | |||
| Raw CoCa | -0.803 | ||
| Human-Aligned | -0.295 | ||
| SkinTone + Gender | -0.027 | ||
| Text-Derived | 1.638 | ||
| PATHS | |||
![[Uncaptioned image]](extracted/5369235/figures/bride_2_same1.png)
|
![[Uncaptioned image]](extracted/5369235/figures/bride_2_same2.png)
|
![[Uncaptioned image]](extracted/5369235/figures/bride_2_diff.jpeg)
|
|
| Human Annotated | |||
| Most Different | 0 of 4 | 0 of 4 | 4 of 4 |
| Diversity Boost Given to Each Image During Ranking. | |||
| Most boosted image is bolded. | |||
| Raw CoCa | |||
| Human-Aligned | -0.269 | ||
| SkinTone + Gender | -1.005 | ||
| Text-Derived | 0.078 | ||
| PATHS | |||
Appendix G Analysis of Human Annotator preference for Gender over Skin Tone.
For all of the 100 triplets, age was similar across the triplets to minimize the effect of other attributes. While we can’t account for all other perceptual attributes being equivalent across the triplets, the trend towards the image with a different gender expression is strong, with 81 out of 100 triplets having the most different image selected as the one with different gender expression. Please see Figure 10 for a similar case study to that in Section 6.
Appendix H Image Attributions
Information for image attributions throughout the paper can be found in this section.
Images in Figure 1:
-
•
https://c1.staticflickr.com/3/2506/4000554611_df3dcd69df_o.jpg (Derek Hatfield, CC-BY 2.0)
- •
-
•
https://farm8.staticflickr.com/7099/7308570096_f97ede5dc3_o.jpg (Jenny Kristoffer, CC-BY 2.0)
-
•
https://farm4.staticflickr.com/7139/7594113252_3ba7086f47_o.jpg (lina smith, CC-BY 2.0)
-
•
https://c2.staticflickr.com/1/1/1191578_4f95f80d43_o.jpg (April, CC-BY 2.0)
- •
-
•
https://c1.staticflickr.com/6/5581/14930736036_63ec66ab29_o.jpg (mistywordpower, CC-BY 2.0)
-
•
https://c6.staticflickr.com/8/7352/8994126007_d407c99ee7_o.jpg (Bengt Nyman, CC-BY 2.0)
-
•
https://c2.staticflickr.com/1/255/18531054670_565d3e0d99_o.jpg (Scott Riggle, CC-BY 2.0)
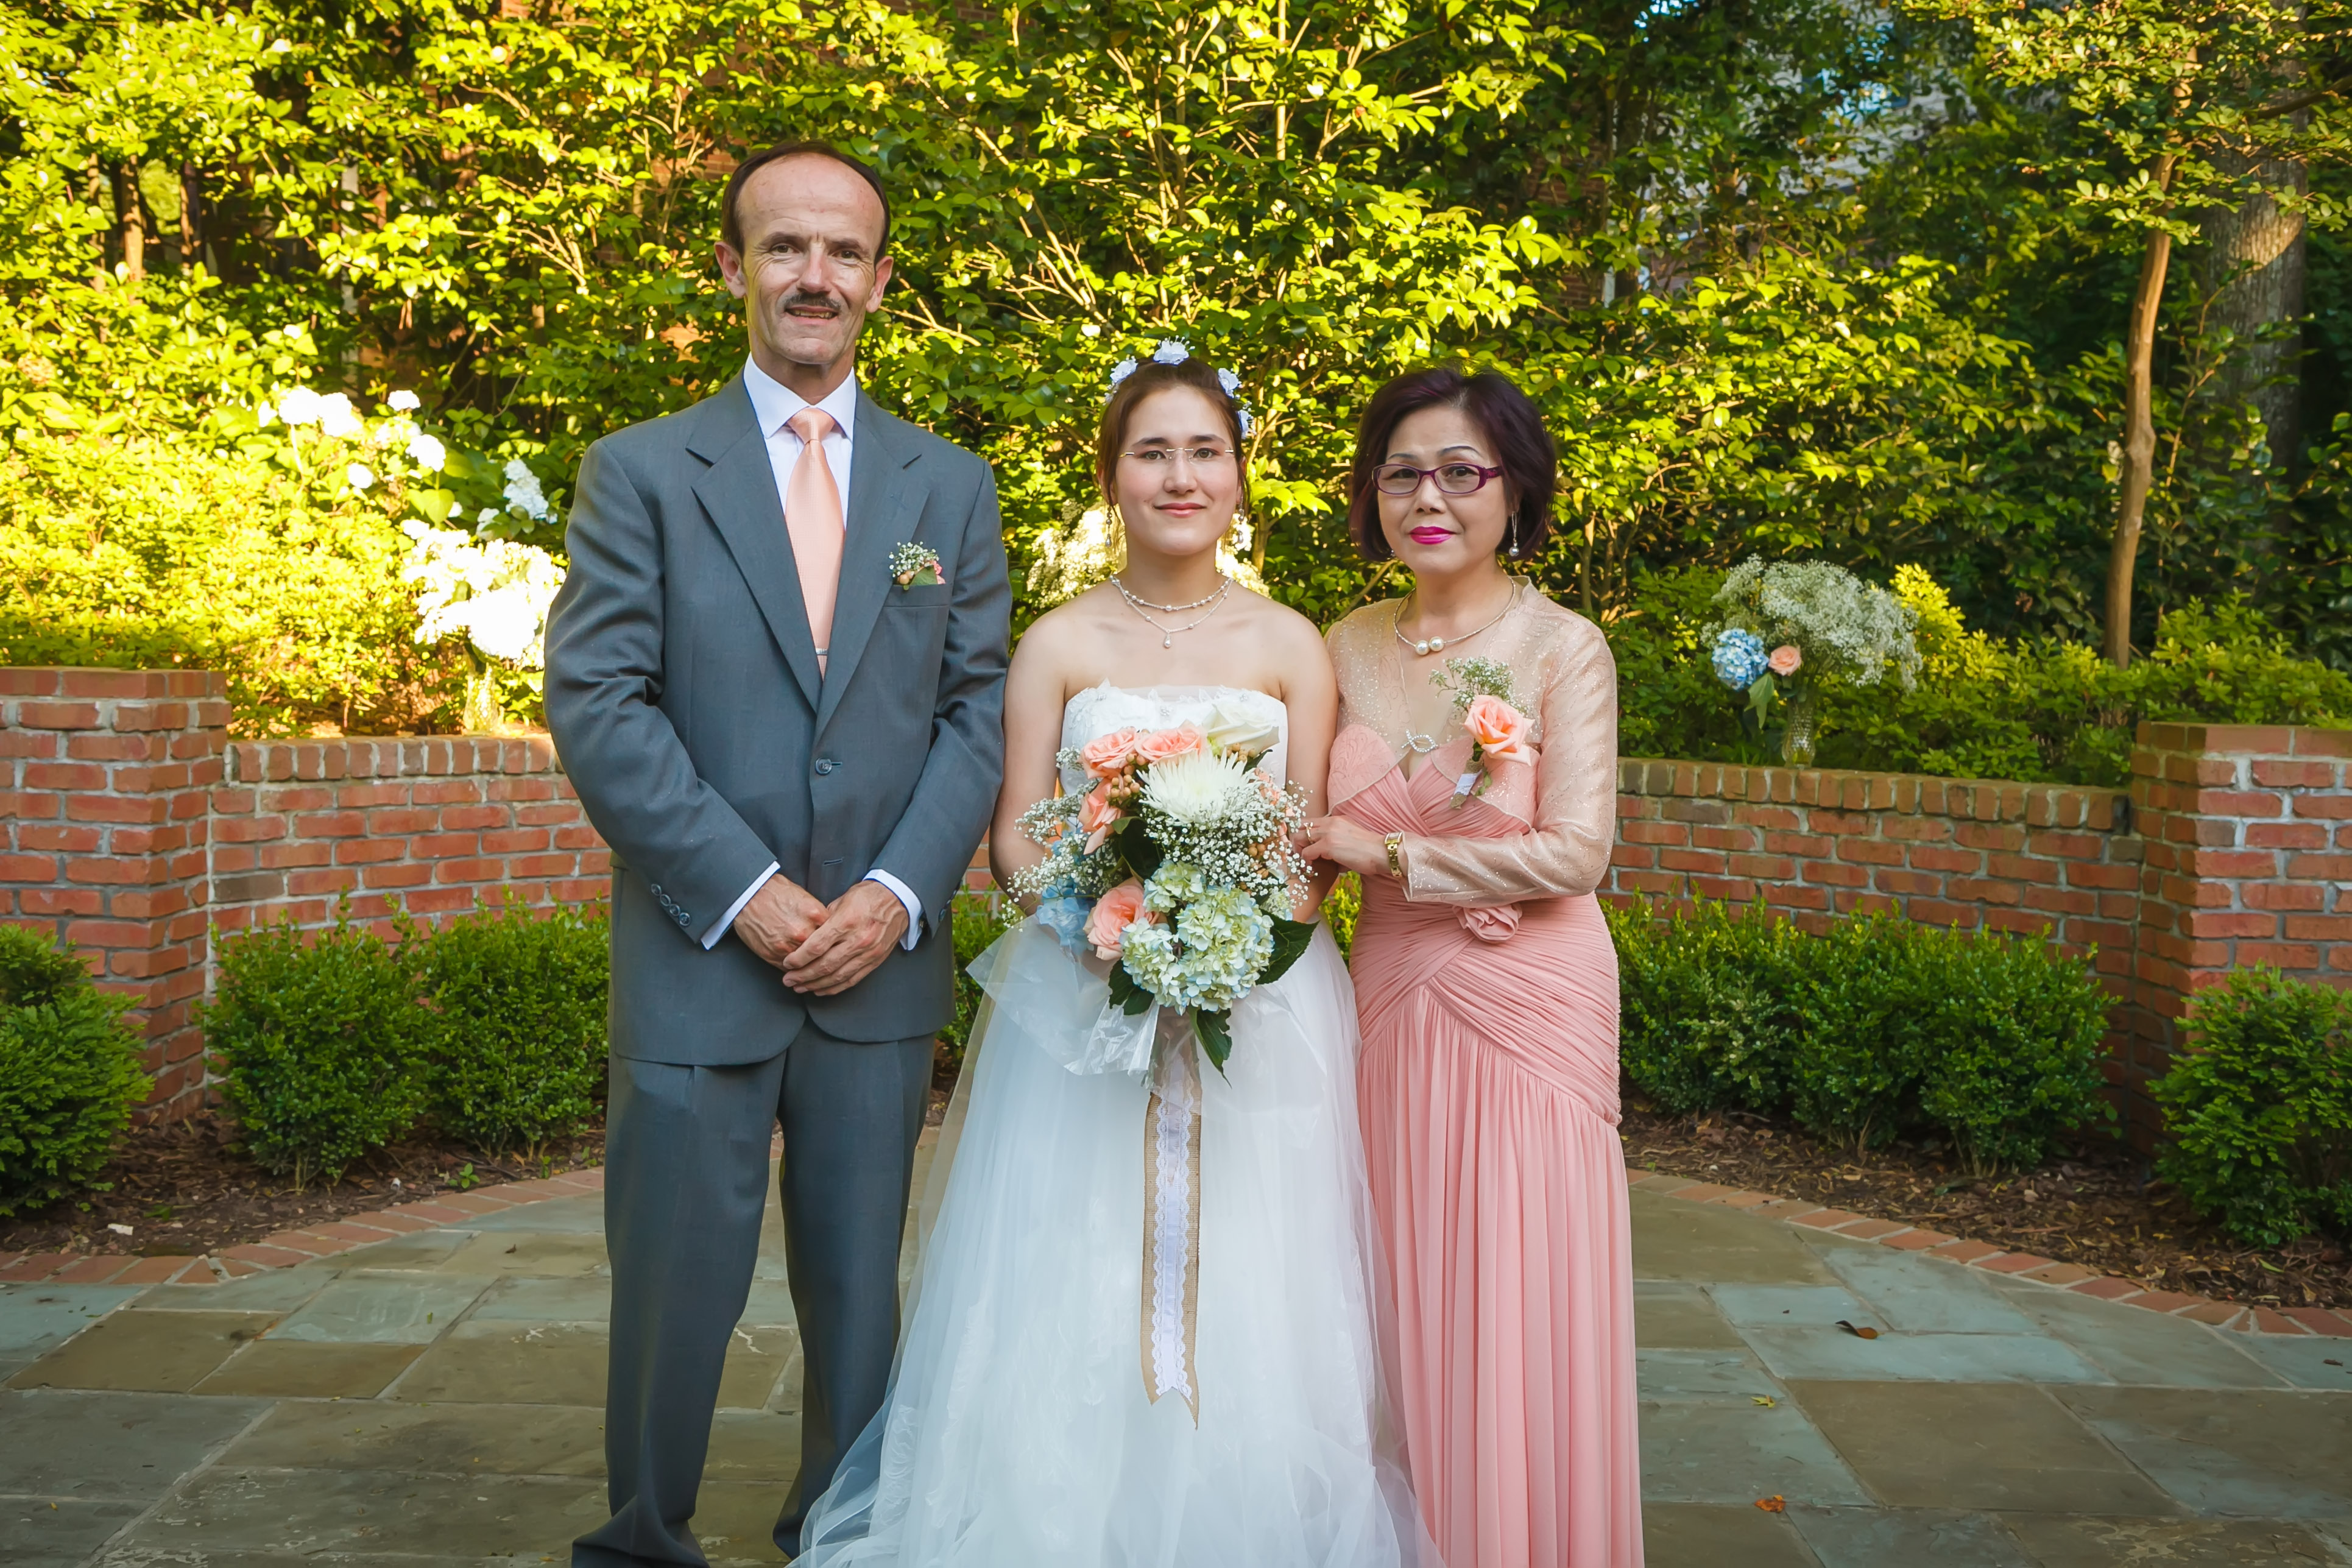
Images in Table 4 (L to R):
-
•
Top row:
- –
-
–
https://openverse.org/image/88bf1e38-aeb1-4bf0-b929-11d21b9eb099 (Alex Neman, CC BY-SA 4.0)
-
–
https://openverse.org/image/3e5a26b2-2508-4a23-8cec-c77813056762 (Ferian-pz, CC BY 2.0)
-
–
Uncropped images as they were shown to human annotators can be found in in Figure 12.
-
•
Second row:
-
–
https://en.m.wikipedia.org/wiki/File:Beautiful_Latina_Woman_Smiling.jpg (epSos.de, CC BY 2.0)
-
–
https://commons.wikimedia.org/wiki/File:Dulamsuren_Yan**dulam_2010.JPG (Wind87, public domain)
-
–
https://openverse.org/image/dd11cfe4-b35c-4264-8b7d-ea11632fdb26 (Dede Rifan, CC BY-SA 4.0)
-
–
Uncropped images as they were shown to human annotators can be found in in Figure 12.
-
–
Images in Figures 4:
-
•
https://c1.staticflickr.com/3/2506/4000554611_df3dcd69df_o.jpg (Derek Hatfield, CC-BY 2.0)
-
•
https://farm4.staticflickr.com/7139/7594113252_3ba7086f47_o.jpg (lina smith, CC-BY 2.0)
-
•
https://c2.staticflickr.com/1/255/18531054670_565d3e0d99_o.jpg (Scott Riggle, CC-BY 2.0)
-
•
https://farm8.staticflickr.com/7099/7308570096_f97ede5dc3_o.jpg (Jenny Kristoffer, CC-BY 2.0)
-
•
https://c6.staticflickr.com/8/7352/8994126007_d407c99ee7_o.jpg (Bengt Nyman, CC-BY 2.0)
-
•
https://c2.staticflickr.com/1/1/1191578_4f95f80d43_o.jpg (April, CC-BY 2.0)
-
•
https://c1.staticflickr.com/6/5581/14930736036_63ec66ab29_o.jpg (mistywordpower, CC-BY 2.0)
-
•
https://c8.staticflickr.com/6/5227/5610128766_5d230cedc4_o.jpg (Lynn B, CC-BY 2.0)
-
•
https://c1.staticflickr.com/5/4072/4677014642_e1a258b40a_o.jpg (Cliff, CC-BY 2.0)
-
•
https://c1.staticflickr.com/3/2506/4000554611_df3dcd69df_o.jpg (Derek Hatfield, CC-BY 2.0)
-
•
https://c2.staticflickr.com/1/255/18531054670_565d3e0d99_o.jpg (Scott Riggle, CC-BY 2.0)
-
•
https://farm4.staticflickr.com/7139/7594113252_3ba7086f47_o.jpg (lina smith, CC-BY 2.0)
-
•
https://c2.staticflickr.com/1/1/1191578_4f95f80d43_o.jpg (April, CC-BY 2.0)
-
•
https://c6.staticflickr.com/8/7352/8994126007_d407c99ee7_o.jpg (Bengt Nyman, CC-BY 2.0)
-
•
https://farm8.staticflickr.com/7099/7308570096_f97ede5dc3_o.jpg (Jenny Kristoffer, CC-BY 2.0)
-
•
https://c8.staticflickr.com/6/5255/5452907146_b2a55a2f35_o.jpg (Jerald Jackson, CC-BY 2.0)
-
•
https://c1.staticflickr.com/6/5581/14930736036_63ec66ab29_o.jpg (mistywordpower, CC-BY 2.0)
-
•
https://c8.staticflickr.com/6/5227/5610128766_5d230cedc4_o.jpg (Lynn B, CC-BY 2.0)
-
•
https://c1.staticflickr.com/3/2506/4000554611_df3dcd69df_o.jpg (Derek Hatfield, CC-BY 2.0)
- •
-
•
https://farm8.staticflickr.com/7099/7308570096_f97ede5dc3_o.jpg (Jenny Kristoffer, CC-BY 2.0)
-
•
https://farm4.staticflickr.com/7139/7594113252_3ba7086f47_o.jpg (lina smith, CC-BY 2.0)
-
•
https://c2.staticflickr.com/1/1/1191578_4f95f80d43_o.jpg (April, CC-BY 2.0)
- •
-
•
https://c1.staticflickr.com/6/5581/14930736036_63ec66ab29_o.jpg (mistywordpower, CC-BY 2.0)
-
•
https://c6.staticflickr.com/8/7352/8994126007_d407c99ee7_o.jpg (Bengt Nyman, CC-BY 2.0)
-
•
https://c2.staticflickr.com/1/255/18531054670_565d3e0d99_o.jpg (Scott Riggle, CC-BY 2.0)
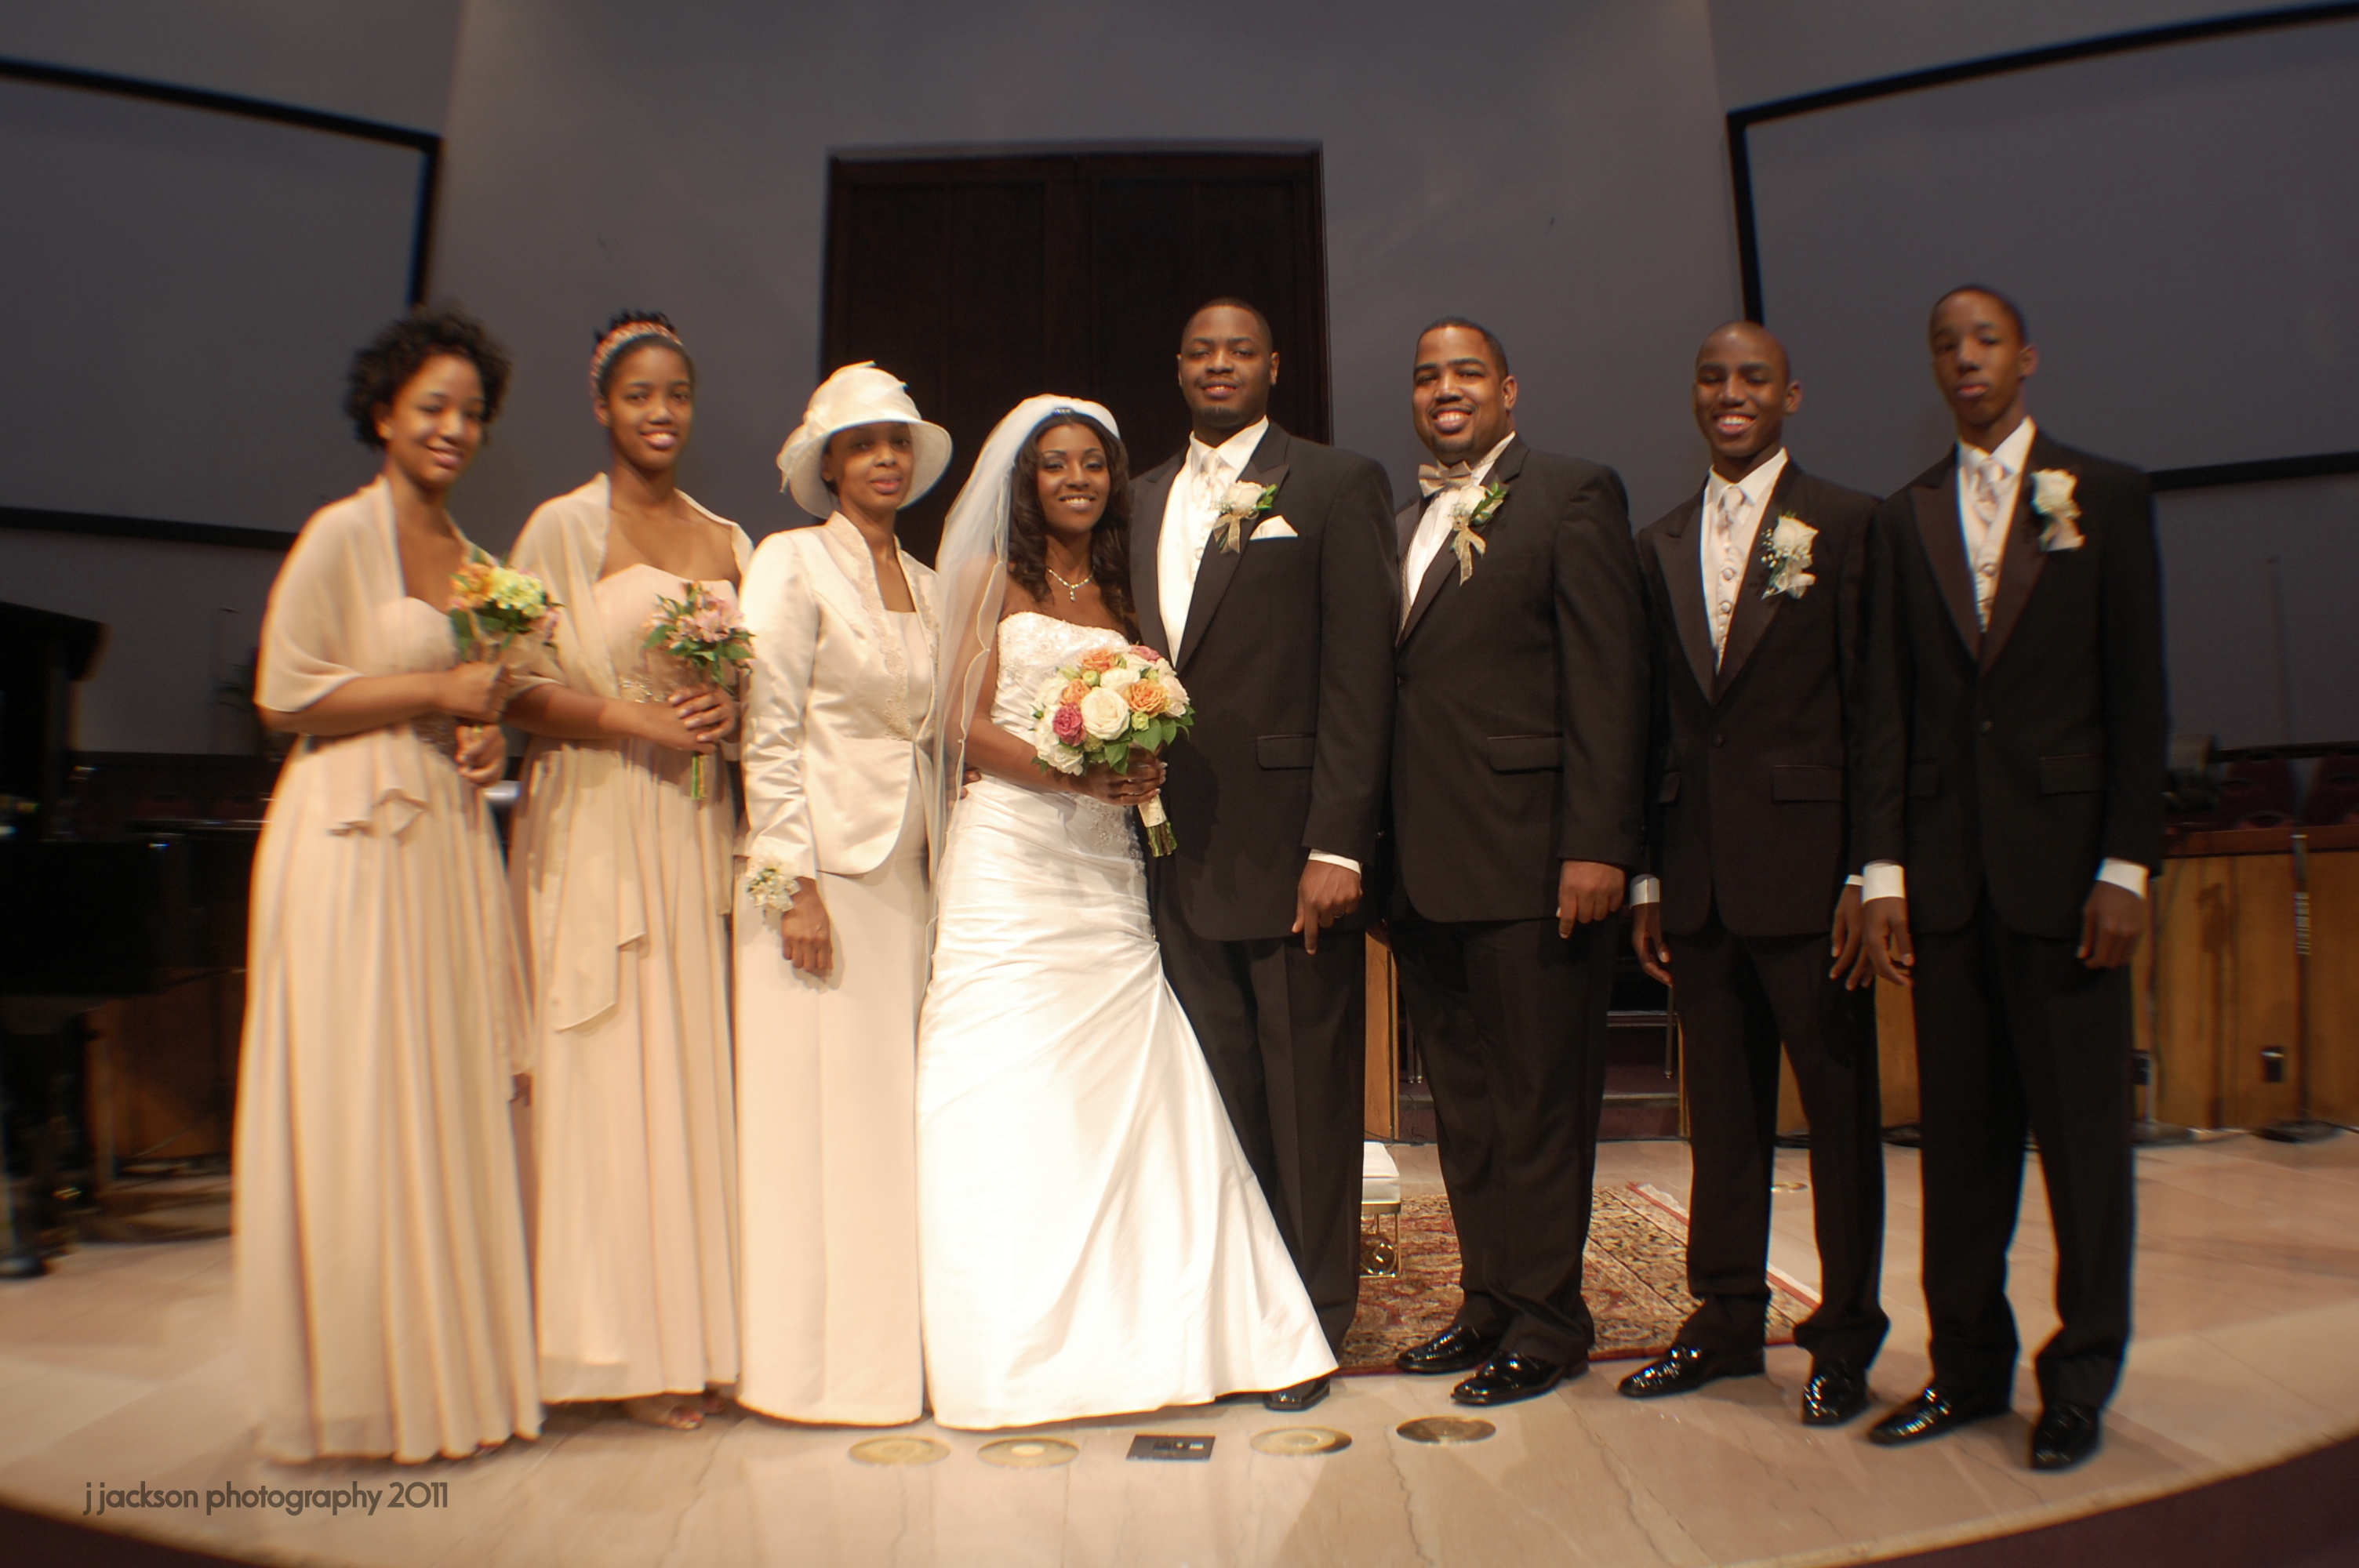
Images in Figures 7, 8, and 9:
-
•
https://openverse.org/image/08bc90f9-3b80-4835-b50a-5cc841e6be65?q=bride. (CherieJPhotography, CC BY 2.0)
-
•
https://www.flickr.com/photos/taedc/14957841864 (Ted Eytan, CC BY-SA 2.0 DEED)
-
•
https://en.m.wikipedia.org/wiki/File:Bride_with_bouquet.jpg (Sherry Main from USA, CC BY-SA 2.0 DEED)
Images in Figure 10:
-
•
https://www.flickr.com/photos/dvanzuijlekom/27045165656/ (Dennis van Zuijlekom, CC BY-SA 2.0 DEED)
- •
-
•
https://www.publicdomainpictures.net/en/view-image.php?image=110301&picture=happy-wedding-day (Geoff Doggett, CC0 Public Domain)
-
•
https://openverse.org/image/08bc90f9-3b80-4835-b50a-5cc841e6be65?q=bride. (CherieJPhotography, CC BY 2.0)
-
•
https://openverse.org/image/ef05c64d-4272-4e56-9c5b-3f60f6d98174?q=tehran%20bride (Taymaz Valley, CC BY 2.0)
-
•
https://www.pxfuel.com/en/free-photo-xsbcj (Free for commercial use, DMCA)
-
•
https://www.flickr.com/photos/taedc/14957841864 (Ted Eytan, CC BY-SA 2.0 DEED)
- •
-
•
https://en.m.wikipedia.org/wiki/File:Bride_with_bouquet.jpg (Sherry Main from USA, CC BY-SA 2.0 DEED)
Images in Table 10:
-
•
Top row (L to R):
-
–
https://pixnio.com/media/pretty-bride-wedding-dress-earrings-side-view (Milivojevic, Free to use, CC0)
-
–
https://pxhere.com/en/photo/1671362 (Purest / 554 Images, public domain, CC0)
-
–
https://commons.wikimedia.org/wiki/File:Indian_Bride_dress_on_wedding_day.jpg (AmanAgrahari01, Creative Commons Attribution-Share Alike 4.0 International)
-
–
Uncropped images as they were shown to human annotators can be found in in Figure 11.
-
–
-
•
Bottom row (L to R):
-
–
https://pixnio.com/media/photo-studio-wedding-dress-wedding-bride-posing (Milivojevic, CC0)
-
–
https://commons.wikimedia.org/wiki/File:Beautiful_Chinese_Bride_in_White_Wedding_Dress.jpg (epSos.de, Creative Commons Attribution 2.0 Generic)
-
–
https://en.m.wikipedia.org/wiki/File:A_bride_in_Xiuhe_dress_near_Xiehemen_%2820220218110303%29.jpg (N509FZ, Creative Commons Attribution-Share Alike 4.0 International)
-
–
Uncropped images as they were shown to human annotators can be found in in Figure 11.
-
–


Appendix I Diverse People Dataset (DPD) Data Card
The Diverse People Dataset Data Card can be found in Table 11. The data can be found at https://storage.mtls.cloud.google.com/paths_for_diversity/DPD_queries.csv
Appendix J Bard Nouns and Adjectives Data Card
The Bard Nounds and Adjectives Data Card can be found in Table 12. The data can be downloaded as follows:
- •
-
•
Nouns and locations: https://storage.mtls.cloud.google.com/paths_for_diversity/nouns_locations.csv
- •
|
Publishers
|
Team
|
Contact Detail
|
|
Data Subject(s)
|
Data Snapshot
Dataset size 15 KB Queries 100 Sub-queries 498 Diversity sub-queries 365 Irrelevant sub-queries 133 Roles & Professions 33 Fashion & Beauty 24 Adjectives/descriptors 18 Misc person references 16 Events 9 |
Data Description
|
|
Primary Data Modality
|
Link to Data
|
Data Fields
|
|
Purpose(s)
|
Domain(s) of application
|
Motivating factor(s) • Releasing the queries allows researchers to replicate this research. • Not releasing the images preserves the rights of the image publishers. |
|
Dataset Use(s)
|
Intended and suitable use case(s) • Research: Fairness research, Diversity research, recommendation research. • Replication: Can be used to replicate our results. • Diversity evaluation: Can be used to evaluate diversity of recommendation/retrieval models. |
Unsuitable use case(s) • Publishing images: users of this dataset should be sure to check copywrite on every image they collect by using this query dataset. |
|
Version Status
|
Dataset version
Current Version 1.0 Last Updated 05/2023 Release Date 10/2023 |
Maintenance plan • Storage: The dataset can be found in the supplemental materials • Versioning: No new versions of this dataset will be made available • Availability: The dataset will be available in the supllemental materials. |
|
Publishers
|
Team
|
Contact Detail
|
|
Data Subject(s)
|
Data Snapshot
|
Data Description
|
|
Primary Data Modality
|
Link to Data
|
Data Fields
Prompts.csv:
NounsLocations.csv
Adjectives.csv
|
|
Purpose(s)
|
Domain(s) of application
|
Motivating factor(s) • Releasing the text sets and prompts allows researchers to replicate this research. |
|
Dataset Use(s)
|
Intended and suitable use case(s) • Research: Fairness research, Diversity research, recommendation research. • Replication: Can be used to replicate our results. |
Unsuitable use case(s) |
|
Version Status
|
Dataset version
Current Version 1.0 Last Updated 05/2023 Release Date 10/2023 |
Maintenance plan • Storage: The dataset can be found in the supplemental materials • Versioning: No new versions of this dataset will be made available • Availability: The dataset will be available in the supllemental materials. |